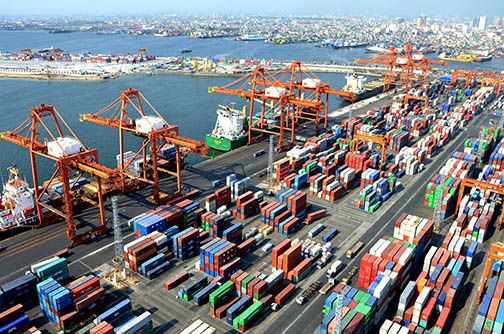

Cargo volume handled by Philippine ports in 2015 dropped 33% to 141.498 million metric tons (mmt) in 2015, down from the 221.241 mmt recorded in 2014, latest data from the Philippine Ports Authority (PPA) showed.
Both foreign and domestic cargoes sustained volume cuts. Foreign cargoes accounted for 57.4%, a drop of 40% to 81.172 mmt in 2015 from 134.171 mmt in 2014. Domestic cargoes, representing 42.6% of the total, contracted 21.7% to 60.326 mmt from 77.07 mmt.
By region, Luzon accounted for the biggest throughput share with 58% or 82.501 mmt, 28.5% lower than its contribution of 115.463 mmt in 2014. Mindanao, which contributed 22.9%, also saw volume shrink by 53.5% to 32.382 mmt last year from 69.574 mmt in 2014. Only Visayas ports, which posted a share of 18.8% of the total, handled slightly more cargoes last year with 26.614 mmt, or 1.6% up from 26.203 mmt.
Imports slipped 22.9% to 50.849 mmt from 65.967 mmt, while exports fell 55.5% to 30.323 mmt from 68.203 mmt.
The export numbers particularly bear out earlier reports from the National Economic and Development Authority, which noted that revenue from Philippine exports fell for the ninth straight month in December 2015, mainly due to lower sales of manufactures, agro-based, and mineral products.
The Manila International Container Terminal (MICT) continued to handle the biggest volume among Philippine ports with 21.573 mmt processed last year, 0.7% higher than 2014’s volume of 21.428 mmt.
Manila North Harbour–which up to the time of coverage of the latest PPA data handled purely domestic cargoes–followed with 16.532 mmt, a 1.7% improvement from the previous year’s 16.240 mmt volume. In December, Manila North Harbour was designated an authorized customs facility by the Bureau of Customs, now allowing it to handle international cargoes.
Cagayan de Oro placed third, recording a 14.1% increase to 5.293 mmt from 4.641 mmt in 2014. Manila South Harbor was ranked fourth with 5.203 mmt processed, 5.8% up from 4.917 mmt, followed by Davao-Sasa with a 7.8% growth to 4.189 mmt from 3.887 mmt.
In terms of container throughput, PPA ports handled 4.3% more boxes in 2015 to 5.558 million twenty-foot equivalent units (TEUs) from 5.328 million TEUs in 2014.
Foreign boxes, which accounted for 57% of the total, declined 1.6% to 3.157 million TEUs from 3.209 million TEUs. Domestic containers, on the other hand, increased 13.4% to 2.401 million TEUs from 2.118 million TEUs.
MICT was also the top contributor in boxes processed with 1.96 million TEUs. This is a 4.4% increment from the 1.877 million TEUs logged in 2014. Likewise posting higher volumes were Manila North Harbour, again in second place, with 1.113 million TEUs lifted, 7.8% up from 1.032 million TEUs, and Manila South Harbor with 807,897 TEUs, 6% up from 762,490 TEUs. Davao-Sasa’s handling of 296,255 TEUs in 2015 was 27% higher than 2014’s traffic of 233,112 TEUs, landing the port in fourth place. In fifth place was Cagayan de Oro for servicing 236,714 TEUs, a 14.7% surge from the previous 206,328 TEUs.
More ships docked at Philippine ports in 2015, recording a 4.2% increase to 371,093 ship calls from 356,157 vessels in 2014. Of the total, domestic vessel calls registered 361,233, or 4.2% higher than the previous year’s 346,540 calls. Foreign ship calls also went up, climbing 2.5% to 9,860 from 9,617. However, it must be noted that vessel size may affect the number of calls, as some liners may have deployed bigger or smaller ships last year.
Meanwhile, more passengers used sea ports last year, increasing 2.5% to 56.258 million in 2015 from 54.898 million in 2014. – Roumina Pablo


